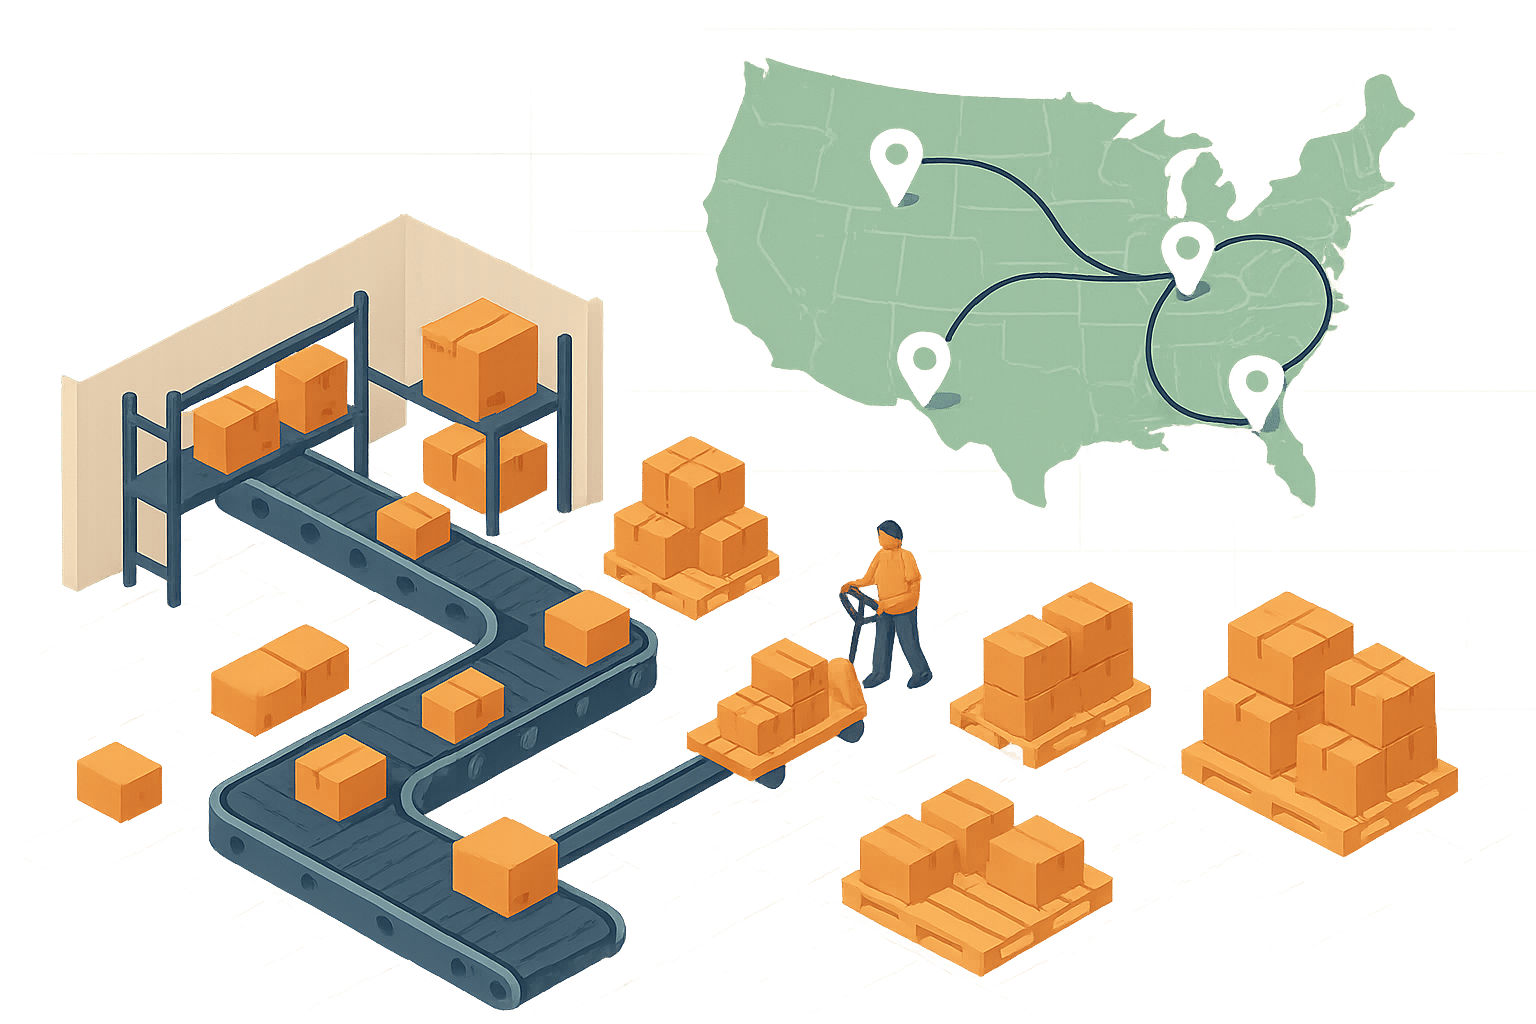
Your 3PL’s performance directly impacts your brand. Late or incorrect deliveries can cost you customers - 69% avoid brands with late deliveries, and 16% stop buying after one mistake. To stay ahead, you need real-time data and clear metrics for evaluating your 3PL partner. Key metrics like on-time shipping, order accuracy, and return processing time help identify issues and improve operations. Tools like Shopify and Forthmatch automate data collection and monitoring, making it easier to track performance and hold your 3PL accountable. Here’s how to use data to ensure your 3PL meets expectations and supports your business growth.
Logistics Strategy Explained - Freight Sourcing, 3PLs & Warehouse Dashboards
Key Data Metrics for 3PL Performance
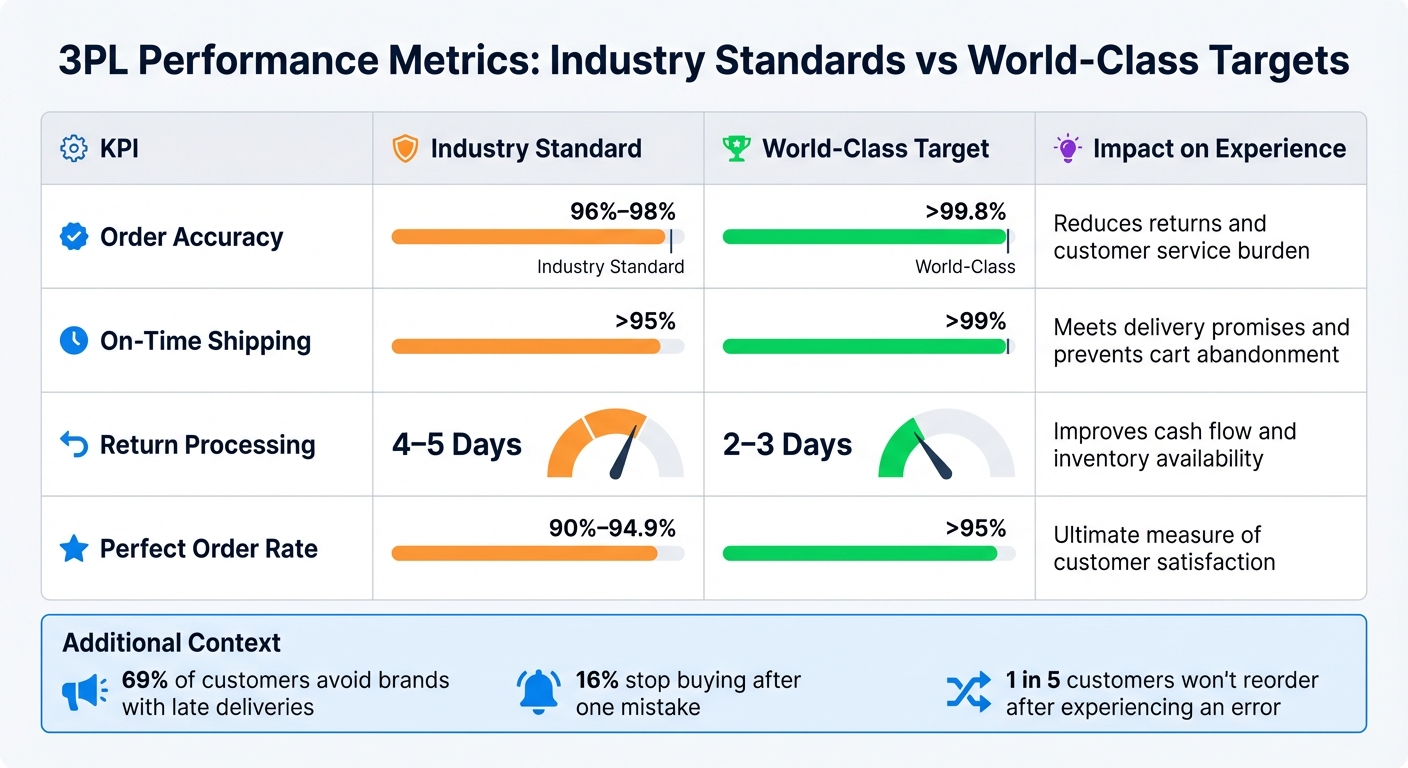
3PL Performance Metrics: Industry Standards vs World-Class Targets
Metrics turn vague concerns into actionable insights. Instead of just feeling like "fulfillment seems slow", numbers can pinpoint exactly where your 3PL might be underperforming. These key performance indicators (KPIs) form the backbone of clear, data-driven reviews, helping refine your 3PL operations.
Fulfillment Speed and SLA Compliance
On-time shipping rate tracks the percentage of orders shipped within the agreed SLA timeframe - whether that’s same-day, 24 hours, or 48 hours. The industry average is about 95%, while top-tier providers hit 99% or higher. This metric directly impacts customer loyalty.
Average fulfillment time measures the period from order placement to shipment. Leading retailers average 1.8 days, and Amazon Multi-Channel Fulfillment clocks in at 1.9 days from order to delivery. Clear SLA definitions, like requiring orders placed by 1:00 PM to ship the same day, eliminate misunderstandings about what "on-time" really means.
"Your customers don't distinguish between failures caused by your fulfillment partner and failures within your direct control - when things go wrong, they hold your brand accountable."
– Steve Rajeckas, Content Marketing Manager, Red Stag Fulfillment
Analyzing both warehouse processing times and total cycle times helps you identify whether delays stem from your 3PL's operations or the shipping carriers. With nearly 50% of online orders abandoned if delivery estimates exceed six days, speed plays a huge role in conversion rates.
Accuracy and returns are the next pieces to evaluate for a full picture of operational performance.
Order Accuracy and Return Processing
Order accuracy rate captures fulfillment errors like wrong items, incorrect quantities, or missing products. Errors are costly - averaging $42 per mistake - and 1 in 5 customers won’t reorder after experiencing one. While industry standards hover between 96% and 98%, top providers maintain accuracy above 99.8%.
Using barcode scanning at every pick station can significantly reduce manual errors, pushing accuracy toward the 99.9% mark. For recurring issues, the "5 Whys" analysis method can help identify root causes, whether it’s training gaps, poor warehouse layout, or understaffing.
Return processing time measures how quickly returned items are inspected, restocked, and made available for resale. With roughly 30% of online orders being returned and processing costs ranging from $10 to $30 per item, speeding up returns to 2–3 days can improve cash flow.
"Shipping accuracy should be a top priority for 3PLs. Everybody loses if our partners' customers don't receive orders on time and in full."
– Tony Runyan, Chief Client Officer, Red Stag Fulfillment
Inventory accuracy ensures you’re not selling items that aren’t actually in stock. Maintaining accuracy above 99.5% with daily cycle counts - especially for fast-moving products - is critical. For example, Red Stag Fulfillment reported a 99.993% accuracy rate in 2024 across inbound, inventory, and on-time shipping metrics.
These KPIs help pinpoint inefficiencies, allowing for quick solutions.
Customer Satisfaction and Delivery Consistency
Speed and accuracy matter, but overall delivery quality is what keeps customers coming back.
Perfect Order Rate is the gold standard, combining completeness, accuracy, timeliness, and damage-free delivery. Industry benchmarks range from 90% to 94.9%, while top performers exceed 95%. To qualify as "perfect", an order must meet all four criteria - any flaw disqualifies it.
Even small misses can add up. For example, with 98% order accuracy and 96% on-time shipping, the combined defect rate might reach 94%, meaning 6 out of every 100 customers experience a flawed delivery. Since 85% of consumers won’t return after a poor delivery experience, this metric is crucial.
| KPI | Industry Standard | World-Class Target | Impact on Experience |
|---|---|---|---|
| Order Accuracy | 96%–98% | >99.8% | Reduces returns and customer service burden |
| On-Time Shipping | >95% | >99% | Meets delivery promises and prevents cart abandonment |
| Return Processing | 4–5 Days | 2–3 Days | Improves cash flow and inventory availability |
| Perfect Order Rate | 90%–94.9% | >95% | Ultimate measure of customer satisfaction |
Segmenting data by carrier and region can uncover delivery inconsistencies. For instance, if certain areas regularly face delays, that insight becomes critical for your next 3PL evaluation. Additionally, tracking dock-to-stock time - how quickly received inventory is ready for sale - is essential. Top-tier providers aim for under 24 hours, compared to the 48-hour industry norm.
When combined with fast shipping and precise order processing, these customer-focused metrics complete your performance review framework.
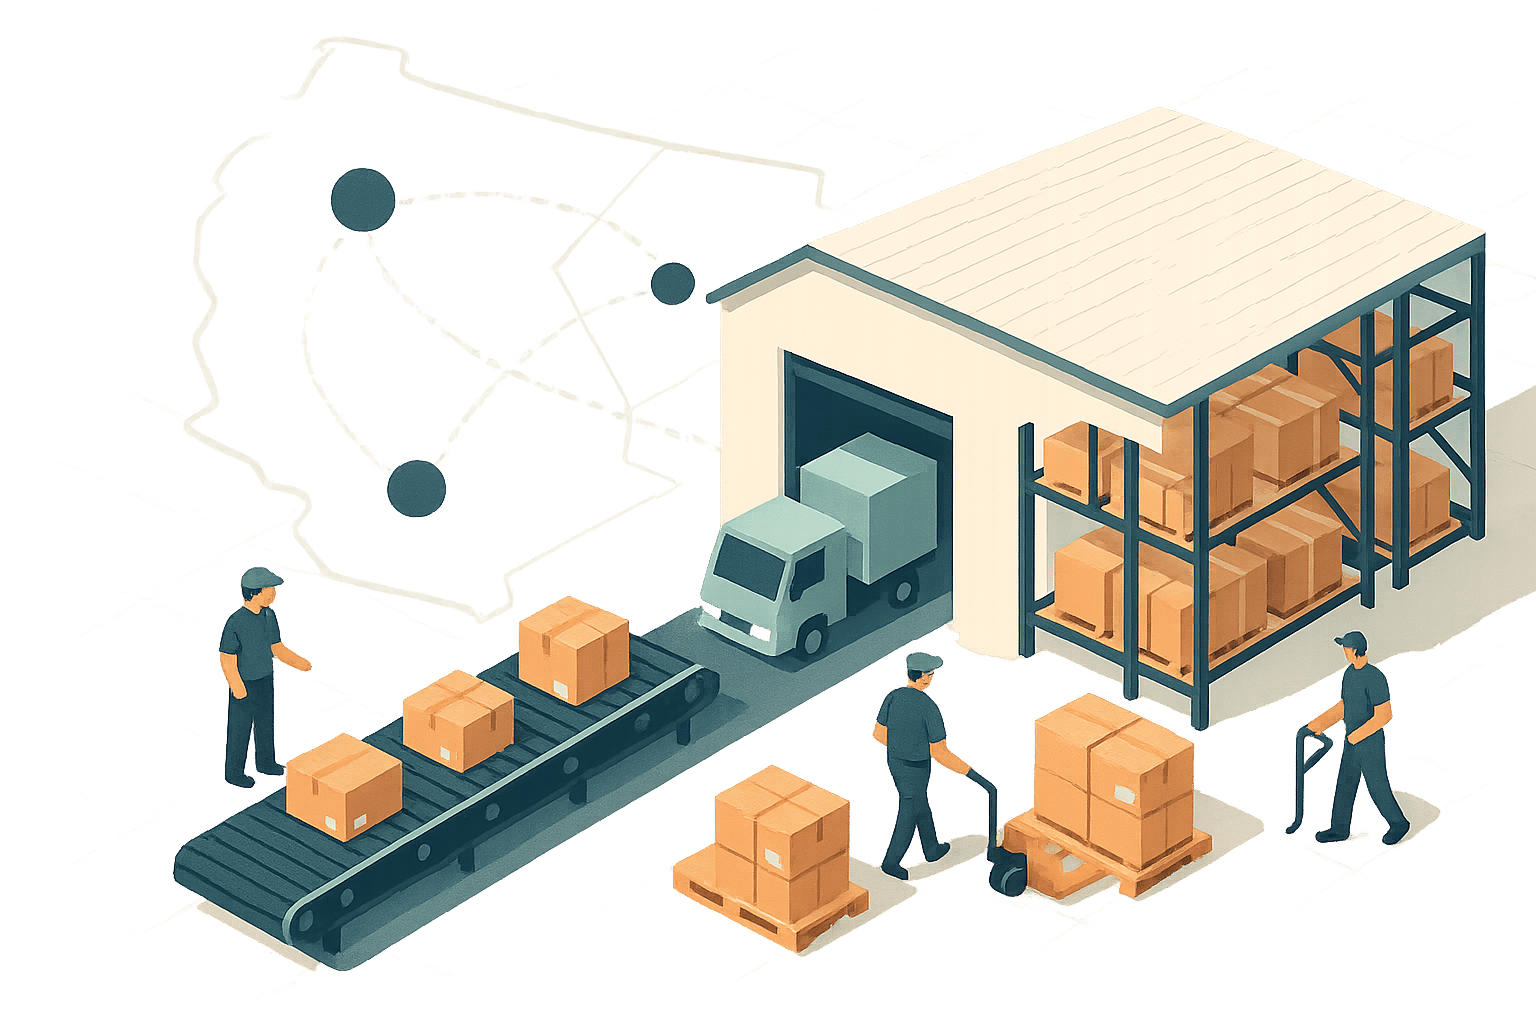
Collecting and Automating Data from Shopify

Tracking the right metrics is only part of the equation - you also need a dependable way to collect and analyze that data without relying on manual spreadsheets. Shopify makes this easier by generating timestamps and fulfillment events that are essential for performance evaluations. However, automation is key to turning this data into actionable insights. Here’s how Shopify’s built-in order data can simplify the process.
Using Shopify's Order Data
Shopify automatically logs fulfillment events that provide a clear picture of your 3PL’s performance. As of September 2025, these events include LABEL_PURCHASED, CONFIRMED, CARRIER_PICKED_UP, IN_TRANSIT, and DELIVERED. To assess handoff times, compare the order’s createdAt timestamp with the CARRIER_PICKED_UP event’s happenedAt timestamp. This detailed tracking lays the groundwork for evaluating 3PL efficiency.
One common issue is that many 3PLs mark an order as "fulfilled" when a shipping label is printed, even if the package hasn’t been picked up yet. By looking at the time gap between the CONFIRMED event (when the order is marked as fulfilled) and the CARRIER_PICKED_UP event (when the carrier scans the package), you can identify delays. If this gap exceeds four hours, it often points to operational slowdowns.
"The difference between order creation and that pickup timestamp? That's your 3PL's fulfillment speed."
– 3PL Pulse
You can manually extract this data by reviewing order timelines in your Shopify admin. However, for stores handling large order volumes, automation is a far more practical and efficient solution. Shopify webhooks like fulfillments/create and fulfillment_events/create can automate this process.
Automating SLA Monitoring with Forthmatch
While manual data collection is possible, automation takes efficiency and accuracy to the next level. Forthmatch leverages Shopify’s order data to automate SLA monitoring and provide real-time alerts.
Forthmatch connects to Shopify with a simple one-click installation from the Shopify App Store. Once installed, it analyzes up to 90 days of historical orders immediately, giving you instant access to performance metrics without waiting for new data. The entire setup process takes less than five minutes.
You can customize SLA parameters by setting specific cutoff times (e.g., orders placed before 2:00 PM must ship the same day), defining processing time targets, and accounting for non-business days. The tool then uses Shopify webhooks to monitor fulfillment events in real time, flagging any orders that exceed your thresholds.
Forthmatch calculates two critical metrics that Shopify doesn’t natively provide: handoff time (from order creation to carrier pickup) and label lag (from when an order is marked fulfilled to carrier pickup). These insights can be exported as CSV reports, which are particularly helpful for monthly reviews or negotiating service credits with your 3PL. Additionally, the platform tracks the alerts you’ve sent and your 3PL’s responses, creating an accountability trail.
"Data-backed accountability - exactly what we needed. Our provider went from ignoring issues to actually responding with action plans."
– vybey AU, Braincare Nutrition
However, there’s a potential limitation: some 3PLs use outdated warehouse management systems that only send a basic "fulfilled" status to Shopify, without the detailed CARRIER_PICKED_UP event. If your provider’s system lacks this functionality, you may need to request direct API integration or consider switching to a 3PL with more advanced tracking capabilities.
Analyzing Data for Trends and SLA Violations
Once you've automated data collection, the next step is turning those numbers into meaningful insights. This means identifying trends and pinpointing why your 3PL might be falling short. By calculating critical metrics, comparing them to industry standards, and breaking down the data into segments, you can uncover patterns and tackle SLA violations head-on.
Calculating Key Metrics and Benchmarks
Start with the Order Accuracy Rate: divide the number of correct orders by total orders, then multiply by 100. For On-Time Shipping Rate, aim for at least 95%, with top-tier performance reaching 99%. Another key metric is Average Fulfillment Time, which is calculated by dividing the total time from order receipt to shipment by the number of orders. Ideally, this should be under 24 hours.
The Perfect Order Index combines several factors - completeness, timeliness, damage-free delivery, and accurate documentation. A strong performance typically falls between 90–95%. These metrics transform general complaints into specific, actionable data points.
To spot trends, use 7-day and 30-day moving averages, which smooth out daily fluctuations. Comparing daily order volumes with performance metrics can also highlight capacity constraints. For instance, if performance dips during high-volume periods, it could indicate a bottleneck.
For inventory, aim for accuracy above 97%, with top warehouses achieving around 99.5%. Dock-to-Stock Time, which measures the time it takes for inventory to be ready for fulfillment after arrival, should ideally stay under 48 hours, with leading performers managing under 24 hours.
Segmenting Data by Carriers and Root Causes
Breaking your data into segments can reveal patterns that overall metrics might hide. For example, analyzing performance by carrier can help determine whether delays stem from internal processes or specific shipping partners. If one carrier consistently outpaces others in delivery times, it might indicate that carrier selection is a major factor in your performance.
Regional segmentation can also highlight areas for improvement. If one shipping zone has significantly lower on-time delivery rates, it might point to localized challenges or the need for more fulfillment centers in that area. Similarly, product-level segmentation can uncover quality control problems. For instance, a spike in returns for "wrong item received" on specific SKUs could signal issues in picking or packing. Comparing different types of orders - such as standard, expedited, or B2B - may also reveal if certain orders are being deprioritized.
A deeper dive into root causes can be achieved using the "5 Whys" technique. By repeatedly asking "why" for an issue like a late shipment, you can uncover the real problem, such as outdated manual processes or inefficiencies in workflows.
Finally, exporting SLA violation data with detailed timestamps - covering order creation, processing start, and carrier pickup - provides hard evidence of performance issues. If the data shows significant SLA breaches, it can support requests for service credits or justify process improvements. This level of segmentation ensures that performance reviews are backed by actionable insights.
sbb-itb-eb0f906
Running Data-Driven Performance Reviews
Once you've gathered the necessary data, performance reviews become the next critical step. These reviews allow you to shift from putting out fires to holding all parties accountable in a structured, proactive way. By focusing on the key metrics and trends you've identified, you can replace subjective debates with solid, data-backed discussions. It's also important to establish a governance rhythm that separates routine operational reviews from strategic planning sessions.
"The solution isn't more frequent check-ins or heated phone calls - it's implementing a systematic approach to measuring, monitoring, and improving your 3PL's performance through data-driven accountability." – Steve Rajeckas, Content Marketing Manager, Red Stag Fulfillment
A solid approach to 3PL management often involves a three-tier review system: weekly operational huddles to address immediate issues like volume surges or carrier delays, monthly KPI reviews to analyze performance metrics and identify deeper issues, and quarterly business reviews to align on strategy and long-term goals. These layers of review work together to ensure ongoing improvement.
Monthly Performance Scorecards
Monthly scorecards turn raw data into a clear, actionable report card. Start by weighting key performance indicators (KPIs) based on your business priorities. For example:
- Order accuracy: 30% (targeting >99.9%)
- On-time shipping: 25% (targeting >99%)
- Inventory accuracy: 20% (targeting >99.5%)
- Dock-to-stock time: 15% (under 24 hours)
- Cost per unit: 10%
By calculating performance for each KPI against its target and summing these weighted scores, you'll get an overall performance grade. A score above 90% signals strong performance, while anything below 80% calls for immediate corrective action.
These scorecards also help maintain financial accountability. For instance, you can export breach data - like specific Order IDs, timelines from order receipt to shipment, and exact delay durations. During monthly reviews, tools like the "5 Whys" can help you dig beyond surface-level problems to uncover root causes. Any findings should be documented in a Corrective Action Plan (CAP), which outlines the issue, the solution, the person responsible, and the deadline for resolution.
Quarterly Accountability Sessions
While monthly scorecards focus on operational details, quarterly sessions take a step back to address broader strategic goals. These sessions cover trends, upcoming seasonal demands (like Black Friday), capacity planning, and long-term contract adjustments. The insights gained here help you prepare for challenges like fluctuating volumes or the need for additional resources.
Forthmatch Accountability Sessions, priced at $89 per session, offer a structured way to establish a performance baseline over 2–4 weeks. They generate a detailed PDF report that compares pre- and post-session metrics. This report includes exportable breach data with timestamps tracking order creation, processing, and carrier pickup. Such reports are invaluable for quarterly reviews, helping you justify service credit requests or pinpoint areas for improvement.
These sessions typically involve senior leadership and strategic decision-makers from both your team and the 3PL. Use this time to ask forward-thinking questions: Can your 3PL handle a projected 40% volume spike during Q4? Are average dock-to-stock times of 36 hours acceptable, or do they fall short of the under-24-hour benchmark? Document all action items, assign responsibility, and set deadlines to ensure follow-through.
Additionally, establish triggers for escalation. For example, if on-time shipping rates drop below 85%, an immediate review should be initiated. For less severe dips, closer monitoring during monthly reviews might suffice. This structured approach ensures accountability and keeps performance on track.
Taking Action: Improving Performance and Monitoring Progress
Data reviews are only as good as the actions they inspire. Once you've spotted performance gaps, it’s time to act. This means moving beyond discussions and setting up systems that ensure accountability. One effective step? Automate alerts to address issues the moment they arise.
Sending Alerts and Adjusting SLAs
When performance drops, timely communication is key. Automated alerts can catch problems in real time, sparing you from discovering them weeks later in a monthly report. Tools like Forthmatch monitor on-time fulfillment with real-time, color-coded alerts. These alerts also create a detailed record of breaches, helping you resolve issues faster and maintain a clear paper trail of your 3PL's responsiveness.
Such documentation proves invaluable during monthly reviews and can support credit negotiations. For example, if 15% of orders regularly miss your 24-hour SLA, you’ll have solid evidence to request service credits or enforce penalties.
If on-time performance consistently misses the mark - say, hitting 92% instead of the 99% target - it’s time to renegotiate your SLA. Use performance data to propose updates, including financial penalties for non-compliance and rewards for exceeding benchmarks. For instance, if your SLA currently requires shipping within 48 hours but your data shows the 3PL averages 36 hours, consider tightening the requirement to 24 hours for 95% of orders. Similarly, if dock-to-stock times average 36 hours against a 24-hour benchmark, document the shortfall and demand improvement within a set period - typically 30 to 60 days, with weekly check-ins.
If alerts and SLA adjustments don’t lead to progress, additional measures may be necessary.
Exploring RFP Options for New Partners
When performance remains below expectations despite corrective actions, it’s time to explore alternatives. Forthmatch’s RFP Quote Request tool, priced at $44 per request, simplifies this process by generating a detailed Request for Proposal based on your actual order data - such as volume, shipping zones, SKU count, and current performance metrics.
This tool connects you with pre-vetted regional providers tailored to your fulfillment needs, allowing you to compare quotes directly against your current provider. It’s not about rushing into a decision - it’s about gaining leverage. And if your current provider doesn’t improve, you’ll already have a plan in place to transition to a better partner.
Establish clear escalation triggers. For instance, if on-time fulfillment stays below 85% after two corrective action cycles or if costs repeatedly exceed budget without explanation, initiate the RFP process immediately. This ensures you’re always ready to pivot when necessary.
Conclusion
Using data to evaluate 3PL performance shifts discussions from subjective opinions to fact-based analysis. Tracking key metrics like order accuracy, on-time fulfillment, and dock-to-stock times helps safeguard your brand. Why? Because customer loyalty is closely tied to fulfillment reliability. These metrics highlight the importance of automated tools that provide immediate, actionable insights.
Switching from reactive monthly reports to real-time monitoring is a game changer. Tools such as Forthmatch simplify this process by integrating with Shopify, flagging SLA violations as they happen, and maintaining a documented record of your 3PL’s responsiveness. This kind of automation lays the foundation for a more disciplined and effective performance review process.
"A 3PL's value lies in its consistent support for your growth through transparency and responsiveness." – Frank P. Crivello, Founder and Chairman, Phoenix Investors
Establish a structured review system to stay on top of performance. This could include weekly operational huddles to address immediate issues, monthly KPI reviews with weighted scorecards, and quarterly business reviews for long-term strategy alignment. With tools like Forthmatch, these reviews become more than just check-ins - they drive measurable improvements. When performance falters, use the "5 Whys" method to dig into root causes, then implement Corrective Action Plans with clear deadlines and accountability.
If your 3PL repeatedly fails to meet expectations despite corrective measures, it might be time to reassess the partnership. Consistently underperforming providers can jeopardize your standards. By relying on real-time data and structured reviews, you’re not just hoping for improvement - you’re ensuring it. This approach keeps your 3PL’s performance aligned with your business goals and your customers’ expectations.
FAQs
How does real-time data help improve 3PL performance reviews?
Real-time data gives you a clearer picture of how your 3PL partners are performing by providing instant insights into key metrics like delivery accuracy, shipping times, and order tracking. With this information at your fingertips, you can quickly spot and resolve performance issues, keeping operations running smoothly and improving customer satisfaction.
Using real-time analytics, you can make smarter, data-backed decisions, compare current performance with past trends, and ensure your 3PL providers meet their service-level agreements (SLAs). This hands-on approach not only streamlines your logistics processes but also helps drive your business forward.
What metrics should you track to evaluate 3PL performance effectively?
When assessing your third-party logistics (3PL) provider, it’s essential to focus on metrics that highlight their reliability, efficiency, and overall impact on your business. Here are some key areas to monitor:
- Order accuracy rate: This shows how often orders are fulfilled without errors - critical for maintaining customer trust.
- On-time shipping rate: Tracks the percentage of orders shipped within the promised timeframe, directly affecting customer satisfaction.
- Fulfillment speed: Measures how quickly orders are processed and shipped, which can influence repeat business.
- Inventory accuracy: Ensures that the reported stock levels align with actual inventory, preventing stockouts or overstocking.
- Customer satisfaction score: Reflects your customers’ experience with delivery, offering a direct look at how your 3PL impacts their loyalty.
By keeping an eye on these metrics, you can pinpoint areas where your logistics partner excels or falls short, ensuring they align with your business goals and service expectations.
How can automation improve the monitoring of 3PL performance?
Automation takes 3PL performance monitoring to the next level by offering real-time data tracking. This means you can spot and resolve issues faster, cut down on manual errors, improve delivery precision, and simplify workflows - all while saving both time and resources.
Using tools like Forthmatch, you can conduct data-driven performance reviews packed with actionable insights. These reviews help you compare historical SLAs, make smarter decisions, and hold teams accountable, keeping your logistics operations running smoothly and effectively.