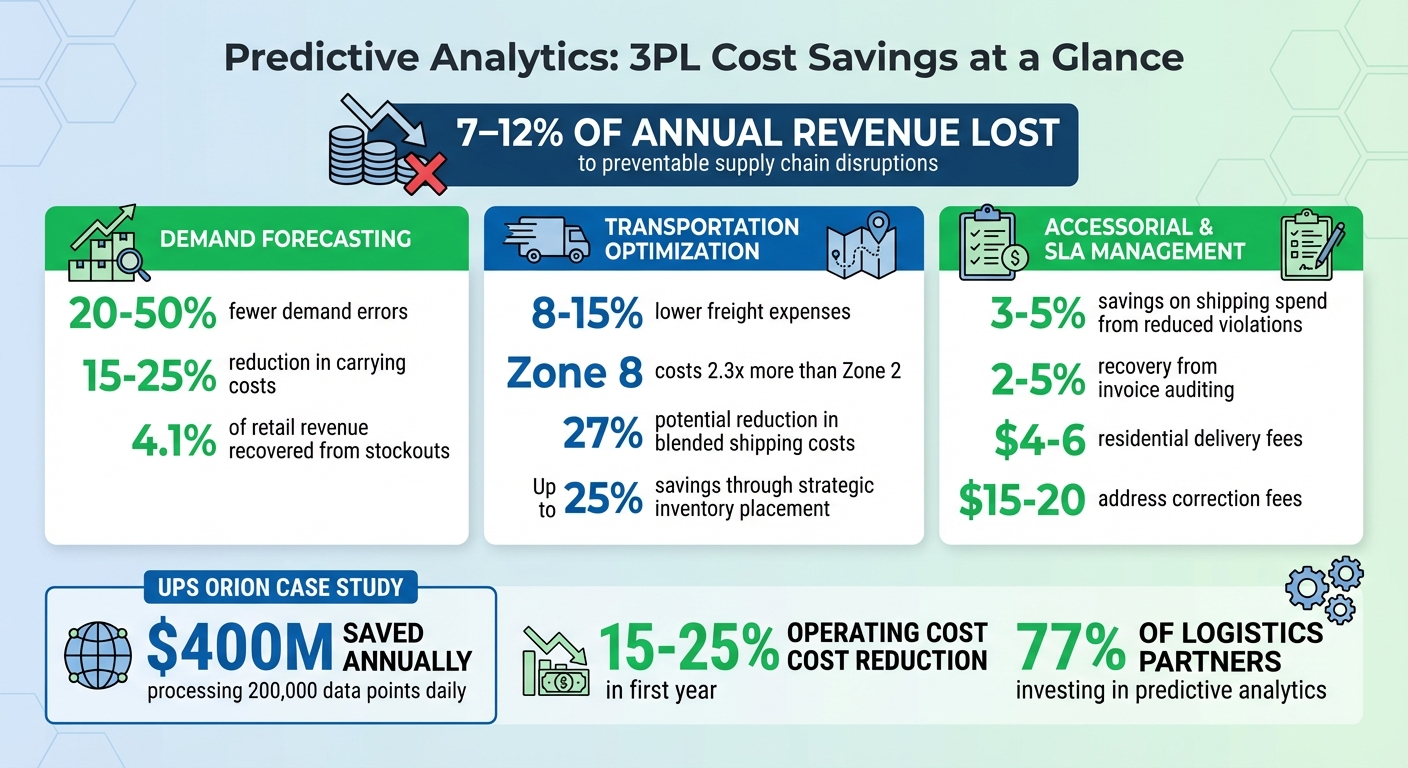
Predictive analytics can save e-commerce brands significant logistics costs by using data to anticipate supply chain issues. Businesses lose 7–12% of annual revenue due to preventable disruptions like stockouts, delivery delays, and high storage fees. Predictive tools analyze historical data, real-time inputs, and external factors to forecast demand, optimize inventory, and reduce transportation costs. Key savings include:
- 20–50% fewer demand errors, cutting carrying costs by 15–25%.
- 8–15% lower freight expenses through better carrier selection and zone mapping.
- Reduced accessorial charges and SLA violations, saving 3–5% of shipping spend.
Companies like UPS save millions annually using predictive models, proving the value of proactive logistics management. Tools like Forthmatch simplify data consolidation, track performance, and generate actionable insights to maximize cost efficiency.
Predictive Analytics Cost Savings in 3PL Logistics
Main Cost Drivers in 3PL Logistics
3PL Cost Components Explained
To manage expenses effectively, it's crucial to understand the key components driving 3PL costs. These costs fall into six main categories.
Inbound shipping and receiving includes the expense of transporting inventory to the warehouse, along with labor fees for unloading and recording goods. These charges are typically billed either as a flat rate or on an hourly basis. Storage and warehousing costs depend on the cubic feet of space occupied, with pricing varying between long-term contracts and pay-as-you-go options. If your inventory requires special handling, like hazardous materials storage, expect additional charges.
Fulfillment fees, often referred to as pick-and-pack costs, cover the labor involved in retrieving items from shelves and preparing them for shipment. These fees are usually charged per item, per order, or as part of a bundled rate. The largest variable expense, however, is transportation and shipping, which accounts for 15–25% of the order value on average. Factors like carrier selection, shipping zones (distance), and dimensional (DIM) weight - calculated using the formula (Length × Width × Height) ÷ 139 for major carriers - play a significant role in determining these costs.
Accessorial charges are often overlooked but can significantly impact your budget. These include fees like fuel surcharges, residential delivery charges ($4–$6 per package), DAS fees ($3–$8), and address correction fees ($15–$20), which can double your base shipping rate. Lastly, reverse logistics - the cost of handling returns - is a major expense, especially for DTC brands with return rates averaging 20–30%.
"Shipping costs grew 35–50% from 2020–2023 due to capacity constraints, fuel surcharges, and carrier pricing power. Brands that didn't optimize saw shipping erode 3–5 points of margin - enough to turn profitable businesses unprofitable." - Satish Jindel, Transportation Analyst, ShipMatrix
Breaking down these costs highlights the areas where predictive analytics can help reduce expenses.
Which Costs Predictive Analytics Can Reduce
Predictive analytics can make a significant dent in three major cost areas.
First, it can lower inventory carrying costs, which typically range from 20–30% of inventory value annually. By using predictive models to analyze historical sales and market trends, brands can optimize stock levels, cutting carrying costs by 15–25%. This approach also minimizes stockouts, which account for 4.1% of retail revenue in lost sales.
Second, transportation and shipping costs can be optimized with predictive tools. These models help determine the ideal mix of carriers and identify when ground shipping can meet 2-day delivery requirements based on zone mapping. For example, shipping to Zone 8 (coast-to-coast) costs 2.3 times more than shipping to Zone 2 (local) for the same service level. Predictive analytics can guide inventory placement to reduce average shipping zones, potentially lowering blended shipping costs by up to 27%.
Third, predictive analytics can tackle accessorial charges and SLA compliance. By monitoring patterns in surcharges and flagging potential delivery delays, brands can reroute shipments proactively to avoid costly chargebacks, which typically represent 3–5% of order value. Automated invoice auditing further helps identify billing errors and service failures, enabling brands to recover 2–5% of their total shipping spend.
These cost reductions directly tie into the KPIs you should monitor to evaluate your logistics strategy.
Baseline KPIs to Track Before Starting
Before implementing predictive analytics, it's important to establish baseline KPIs to measure progress. Start with your blended cost per package - calculated by dividing total shipping spend by the total number of packages shipped. For most DTC brands, a target range of $7–$12 per order is ideal.
Next, track your on-time delivery percentage, aiming for a rate above 95%. Falling below this threshold indicates carrier issues that predictive models can help address. Keep an eye on your SLA violation rate to understand how often your 3PL fails to meet deadlines for picking, packing, or shipping.
Additionally, review your zone distribution to identify opportunities for repositioning inventory closer to customers. Finally, calculate your surcharge incidence rate, which measures how often orders incur extra fees like residential or DAS charges. High-volume shippers can use this data to negotiate waivers, potentially saving thousands of dollars each month.
Data Requirements for Predictive Analytics
Data Sources E-Commerce Brands Need
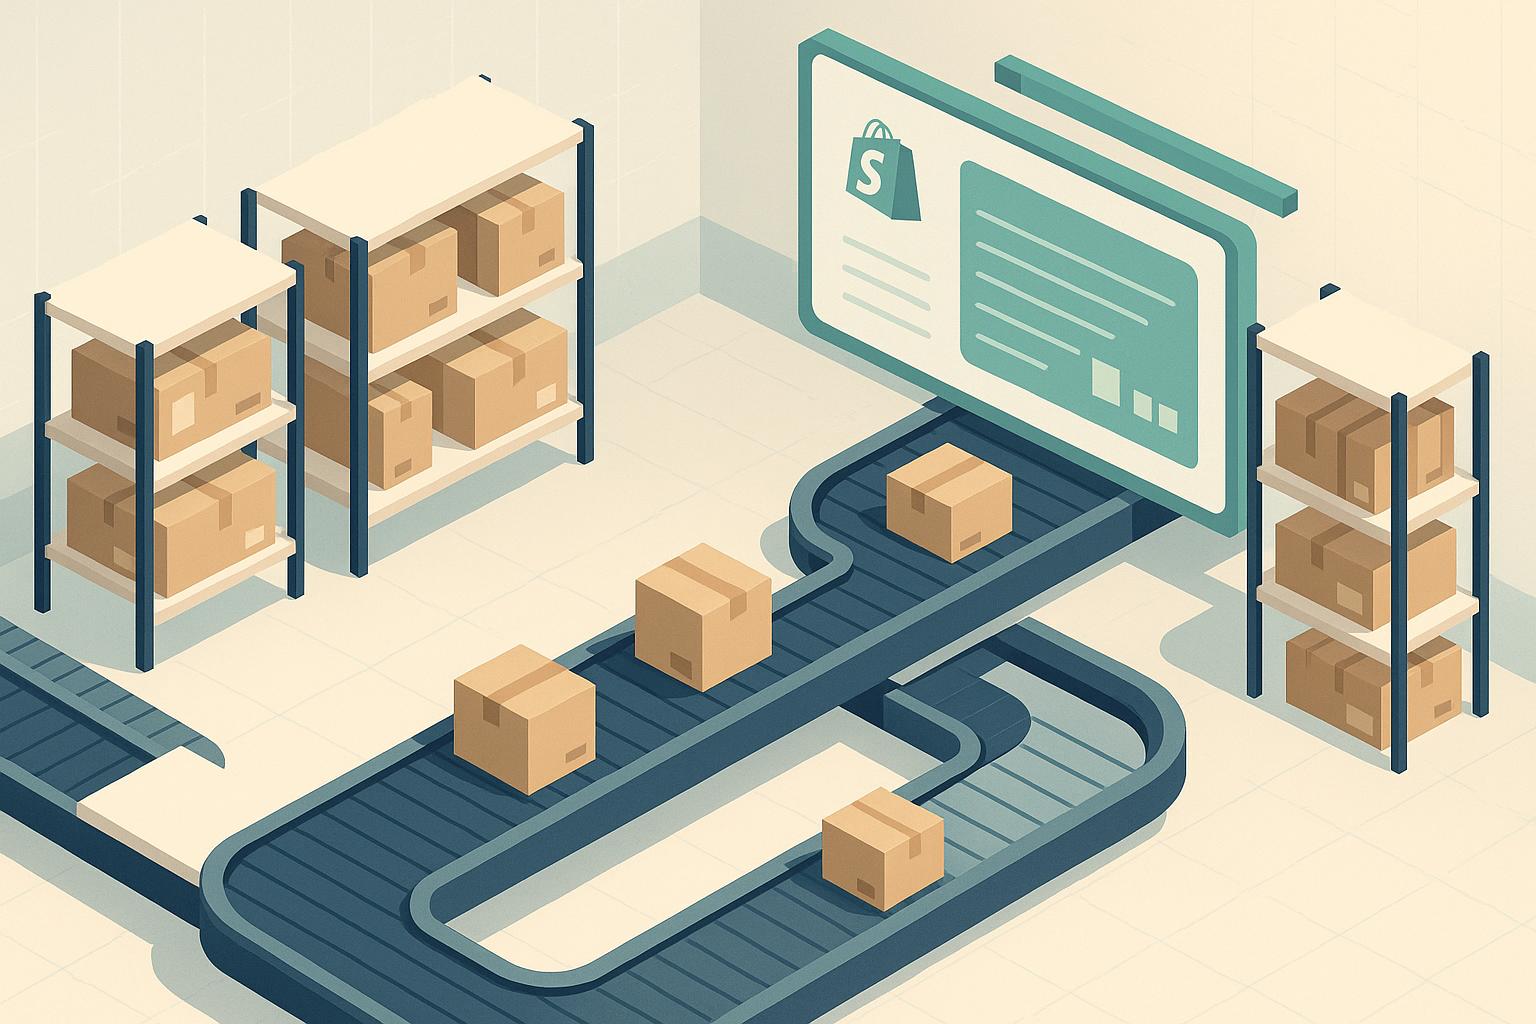
To create effective predictive models, e-commerce brands need data from a variety of sources. At the core is your Shopify order data, which provides insights into historical sales, SKU performance, return rates, and seasonal trends. This data is essential for understanding demand patterns and customer behavior over time.
Next, you’ll want to incorporate 3PL WMS data - this includes stock levels, turnover rates, picking paths, and labor hours. Pair this with carrier tracking data from your shipping partners, which covers GPS tracking, transit times, carrier rates, and fuel usage. Together, these datasets help optimize shipping and logistics decisions.
Don’t overlook external factors like weather, traffic conditions, fuel prices, and port congestion. These variables can significantly impact supply chain efficiency. For instance, United Parcel Service (UPS) uses its ORION routing system to process 200,000 data points daily - including addresses, weather, and traffic - to optimize delivery routes for 55,000 vehicles. This approach reportedly saves the company $400 million annually.
"Utilizing this data is essential for predictive decision-making and efficiency optimization. By analyzing both historical and real-time data, 3PL providers can anticipate demand fluctuations, optimize inventory levels, and streamline transportation routes."
– Custom Goods
For accurate predictions, you’ll need at least 18–24 months of clean, historical data. Without this, companies risk losing 7–12% of their annual revenue due to preventable supply chain issues.
Preparing Your Data for Predictive Models
Raw data from different sources often contains inconsistencies that can lead to inaccurate predictions. Start by cleansing your data - this means removing corrupted files, anomalies, and extreme outliers that could distort your models. Clean data ensures your algorithms work with reliable inputs.
Standardization is another key step. Align naming conventions, product codes, and IDs across systems - for example, matching "SKU-12345" with "PROD-12345" - so your models can correctly identify identical items. Similarly, normalizing terminology across platforms makes cross-system analysis possible.
After cleansing and standardizing, consolidate data from ERP, WMS, carrier systems, and external sources into a single, unified platform.
"If the input is wrong, the forecasts won't be worth much."
– Helen Barkouskaya, Head of Partnerships, Whitefox
AI-driven forecasting can outperform traditional spreadsheet methods, reducing forecast errors by 20–50%. To get started, consider launching a small-scale pilot. Focus on one product category or a single distribution center to validate the return on investment before scaling across your supply chain.
Once your data is clean and consolidated, a centralized platform becomes the foundation for generating actionable insights.
How Forthmatch Centralizes Your Data
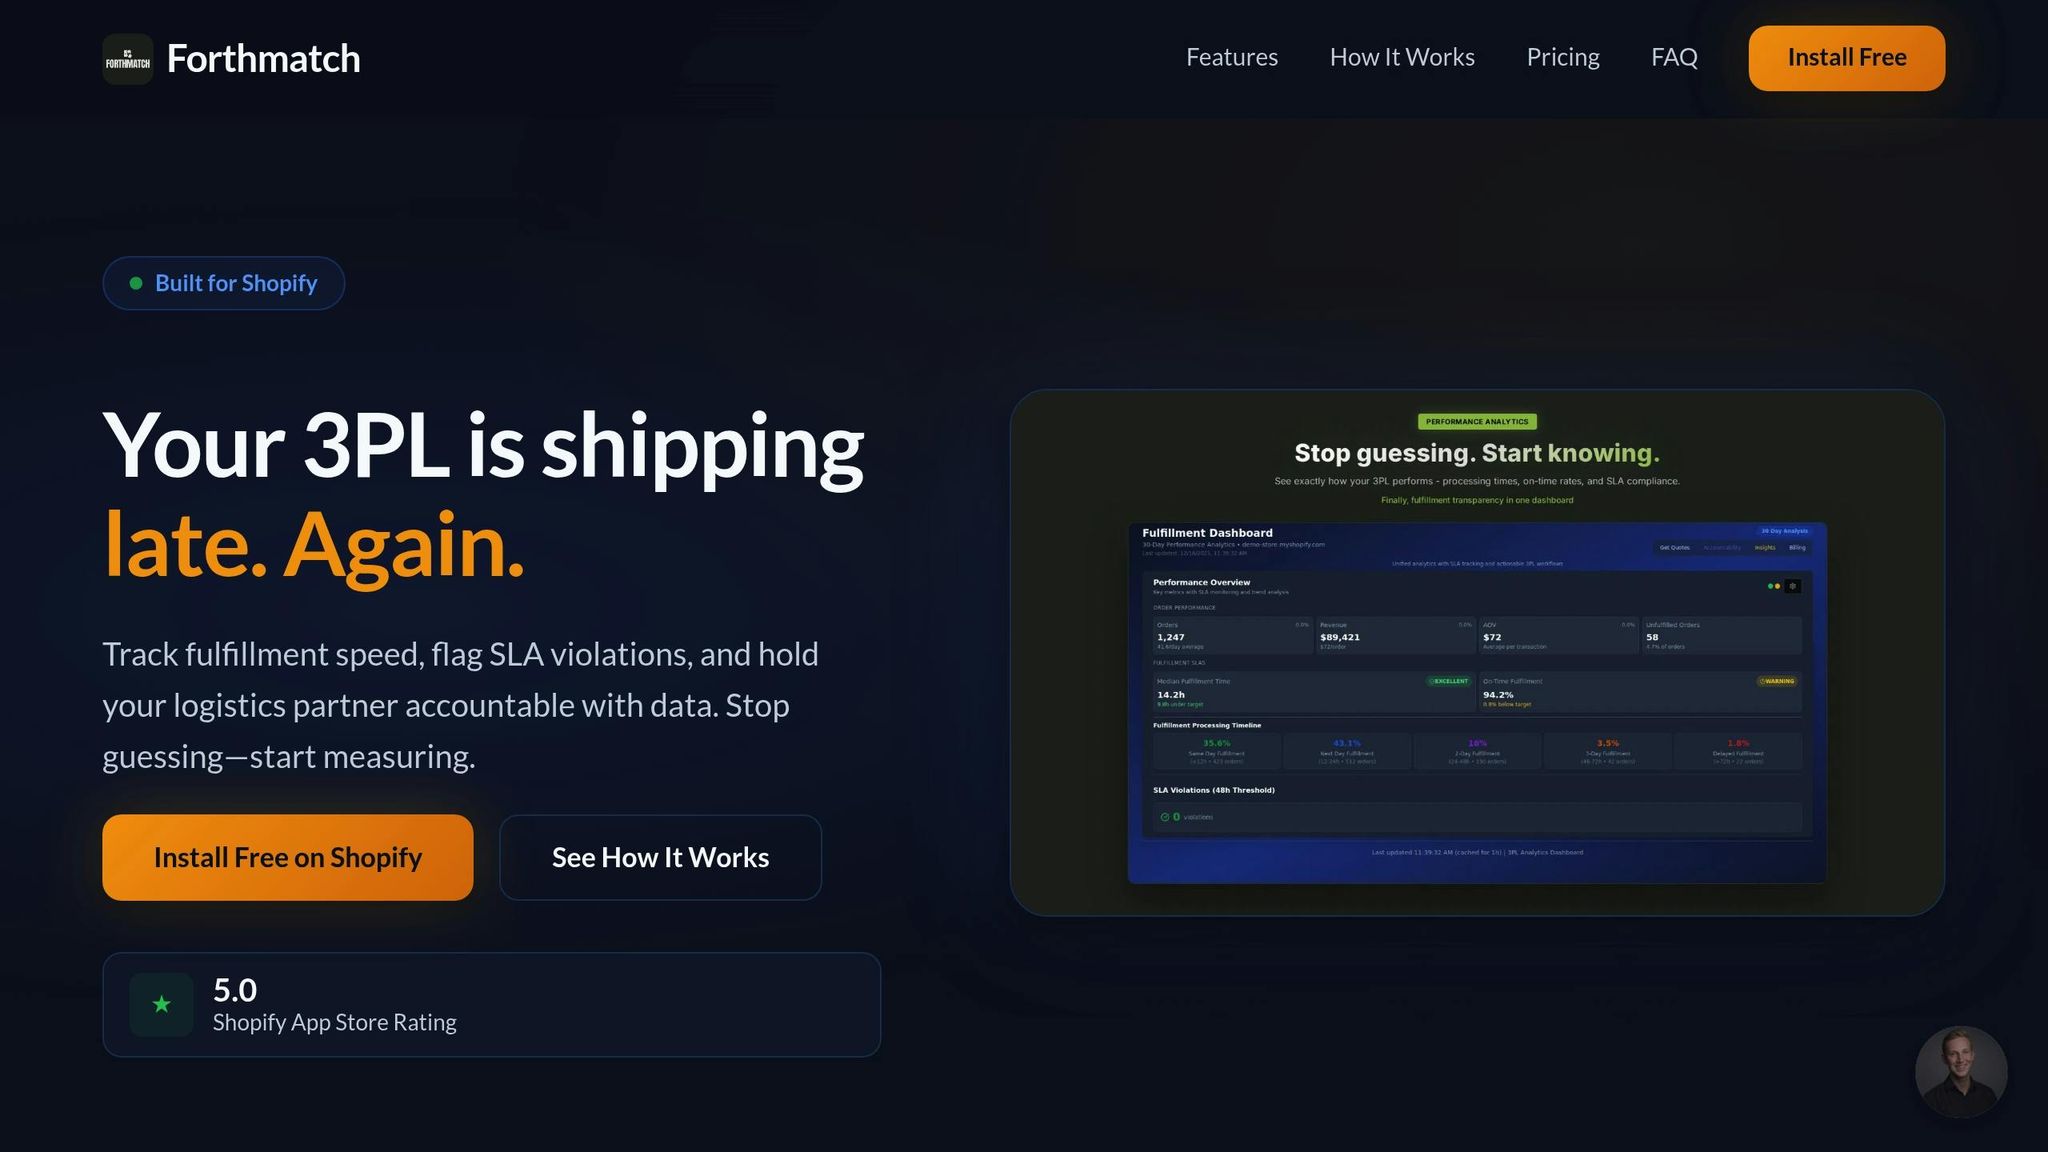
Forthmatch simplifies data management by integrating directly with your Shopify store. It automatically retrieves order history by calculating the time between "Order Created" and "Fulfillment" timestamps. This automation eliminates the need for manual data entry and provides immediate visibility into your 3PL's shipping performance - analyzing up to 90 days of historical data right after installation.
The platform tracks SLA performance by monitoring metrics like order time-to-fill and on-time delivery rates against your benchmarks (e.g., "ship within 24 hours"). It flags SLA violations and pinpoints root causes, such as warehouse bottlenecks or carrier delays. By identifying these patterns, you can address inefficiencies and reduce unnecessary costs.
Forthmatch also analyzes historical shipment and carrier performance data to uncover trends that inform predictive models. For example, you might find that a specific carrier consistently fails to meet SLAs in certain regions during peak season. With this insight, you could reroute shipments or renegotiate contracts. The platform’s trend reporting highlights whether a provider’s performance is improving or declining over time, giving you the data needed for informed contract negotiations.
Companies that adopt data-driven forecasting can reduce operating costs by 15–25% within the first year. Forthmatch’s centralized system ensures your data is clean, accessible, and ready to support powerful predictive analytics - without the hassle of manually reconciling spreadsheets from multiple sources.
How to Use Predictive Analytics for 3PL Cost Savings
Demand Forecasting and Inventory Optimization
Predictive analytics takes inventory management from a reactive scramble to a well-planned strategy. Modern forecasting models juggle 20–40 variables at once - things like promotional calendars, competitor pricing, weather patterns, search trends, and real-time sales velocity. Compared to traditional spreadsheet methods, this approach cuts forecast errors by 20–50%.
The financial benefits are hard to ignore. Companies using data-driven forecasting often see inventory costs drop by 15–25% in the first year. For instance, one regional beverage distributor used weather forecasts and local event calendars to improve its accuracy from 68% to 89%. This adjustment not only reduced stockouts during peak summer weeks by 32% but also cut obsolete inventory by 18%.
Accurate forecasts also allow for smarter inventory placement. Predicting demand down to specific ZIP codes or store-SKU combinations means inventory can be strategically positioned in the right distribution centers before orders even roll in. One electronics distributor, for example, slashed its total inventory investment by $2.1 million (a 22% reduction) while boosting fill rates from 84% to 93%.
For businesses dealing with perishable or seasonal items, predictive analytics can be a game-changer. A consumer goods company used early demand signals from online search trends to adjust production when it noticed a 15% week-over-week surge in search volume. This move, made three weeks ahead of time, prevented stockouts that could have cost over $400,000 in lost revenue.
When inventory is managed proactively, it creates a strong foundation for optimizing shipping and reducing transportation costs.
Carrier and Transportation Cost Optimization
Predictive analytics can significantly cut transportation costs by analyzing carrier performance across various factors and pinpointing the most cost-effective options. By monitoring carrier reliability in different regions and during peak seasons, companies can identify underperformers and adjust shipments or renegotiate contracts accordingly.
Machine learning models take this a step further by continuously assigning carriers based on real-time performance data, cost, and adherence to service-level agreements (SLAs), rather than relying on static contracts. This dynamic approach ensures that carrier selection is always optimized for current conditions.
A great example of this is UPS's ORION platform. It processes 200,000 data points daily - covering addresses, weather, and traffic - to optimize routes for 55,000 vehicles. This system saves UPS over $400 million annually by reducing mileage and fuel consumption. While most e-commerce brands don’t operate on UPS’s scale, predictive routing can still lower freight costs by 8–15%.
Predictive tools also help uncover hidden costs, such as dimensional (DIM) weight adjustments, fuel surcharges, and address correction fees. By identifying these expenses, businesses can adjust packaging sizes or shipping methods to avoid unnecessary charges. Additionally, automated invoice auditing tracks delivery exceptions and missed SLA commitments, helping companies recover refunds from carriers.
SLA Risk Prediction and Prevention
Beyond demand and transportation optimization, predictive analytics plays a crucial role in safeguarding service levels by anticipating SLA breaches. These models act as early warning systems, monitoring on-time delivery trends, quality metrics, and even suppliers' financial stability to flag potential issues weeks in advance. This gives businesses a 2–4 week window to secure backup carriers or alternative suppliers when primary providers show signs of trouble.
Ignoring these early warnings can be costly. Companies without predictive tools often lose 7–12% of their annual revenue to preventable supply chain disruptions. On the other hand, AI-driven logistics solutions typically push on-time delivery rates from the low-to-mid 80s to the mid-90s.
Real-time risk mitigation is another benefit. Predictive models analyze factors like port congestion, weather, and traffic to recommend dynamic rerouting. For example, if a high-risk order is flagged due to a carrier’s declining performance or forecasted weather delays, the system can intervene to prevent service failures that could lead to expedited shipping costs or penalties.
Platforms like Forthmatch enhance these capabilities by tracking historical performance data and flagging SLA violations in real time. By analyzing up to 90 days of order history, the platform identifies patterns, such as a carrier consistently missing delivery windows during specific periods. This historical context sharpens predictive accuracy, enabling businesses to address inefficiencies before they escalate into major problems.
The shift from reactive to proactive management is clear: 77% of logistics partners are now investing in predictive analytics to improve risk visibility. This trend underscores a major change in supply chain management, where companies can anticipate challenges - like supplier bankruptcies or port strikes - long before they hit the bottom line.
Turning Predictive Insights into Cost Savings
Optimizing Inventory and Purchasing Decisions
Predictive demand forecasts offer a smarter way to manage inventory. Instead of relying on static safety stock formulas, dynamic reorder points can be set to proactively address demand changes. This helps avoid the panic of expedited freight costs or the revenue loss that comes with stockouts.
The real savings come from fine-tuning inventory levels. Advanced analytics can pinpoint the ideal stock quantity for each SKU, balancing product availability with carrying costs. By setting precise stock targets, businesses can reduce unnecessary inventory and cut down on 3PL storage fees.
Additionally, analyzing historical ZIP code data identifies fulfillment centers that best serve high-demand regions. This approach can reduce shipping costs by up to 25% and cut transit times by about 15%. Spreading inventory across multiple locations allows orders to be fulfilled closer to the customer, eliminating the need for costly cross-country shipments.
These inventory strategies naturally lead to smarter decisions about carrier selection and shipping methods, further driving down costs.
Choosing the Right Carriers and Service Levels
Once inventory is optimized, predictive insights can refine how you choose carriers and service levels. Automated systems can route non-urgent orders through cost-effective carriers while saving premium services for time-sensitive or high-value shipments.
Carrier ranking models take this a step further by analyzing historical performance data. They predict which carriers are most reliable for specific routes and conditions, allowing businesses to prioritize providers with strong on-time delivery records. This approach can reduce freight costs by 8–15%, especially for mid-market companies leveraging predictive logistics.
Zone optimization is another game-changer. Predictive models evaluate where orders are headed and help align fulfillment centers with shipping destinations, cutting both transit times and transportation expenses.
Taking advantage of bulk carrier discounts is also key. By consolidating shipment volumes across major providers, businesses can negotiate better rates than they might secure individually. Regularly reviewing these rates with predictive benchmarks ensures competitive pricing over time.
Managing 3PL Performance with Predictive Analytics
Predictive analytics transforms 3PL partnerships into data-driven collaborations. Metrics like fulfillment speed, accuracy, and SLA compliance are tracked over time, enabling early intervention when performance dips threaten customer satisfaction.
With centralized data, tools like Forthmatch can automatically flag potential issues by analyzing order histories. For example, automated alerts can highlight low inventory levels or recurring fulfillment delays, allowing businesses to address problems before they escalate. Forthmatch can analyze up to 90 days of order history, uncovering patterns such as consistent delays with specific carriers, which provides solid evidence for discussions with 3PL providers.
Historical performance data, combined with market benchmarks, also strengthens your position during contract negotiations. One example is The Adventure Challenge, which grew to $80 million in annual revenue by leveraging a global fulfillment network. This strategy minimized shipping costs by prioritizing in-country fulfillment over expensive cross-border shipping.
Establishing regular review cycles ensures that predictive recommendations align with actual outcomes. Over time, as predictive models improve, these iterative adjustments can lead to even greater savings and efficiency.
sbb-itb-eb0f906
Measuring and Maintaining Cost Savings
Key Metrics for Measuring Savings
To gauge efficiency, start with cost per order (CPO). This is calculated by dividing your total fulfillment costs by the number of orders shipped. It’s a straightforward way to see how warehousing, labor, and transportation decisions impact your overall operation.
Another critical metric is the average shipping zone, which reflects how well your inventory is positioned. If you’re using predictive analytics to manage multi-location fulfillment, this number should decrease as more orders ship from warehouses closer to your customers. A lower average zone means reduced shipping costs and quicker delivery times.
Keep an eye on SLA violation rates to assess service quality. Aim for on-time delivery rates above 95% and order accuracy exceeding 99.5%. These benchmarks reveal whether predictive models are effectively preventing delays and errors. Additionally, track your blended cost per package, which accounts for hidden shipping surcharges. For direct-to-consumer (DTC) brands, shipping typically accounts for 8–12% of total revenue, so even small savings can make a big difference.
Finally, ensure your data remains accurate by establishing robust data governance practices.
Setting Up Data Governance with 3PLs
Predictive models can’t function properly without accurate, up-to-date data. Start by centralizing all your ERP, WMS, and financial data into a single platform. This eliminates inconsistencies caused by different teams relying on separate spreadsheets or reports.
Implement monthly review cycles to compare your predictions against actual outcomes. Regular reviews allow you to fine-tune algorithms as market conditions change. For instance, a regional beverage distributor improved their forecast accuracy from 68% to 89% by incorporating weather data and local event calendars into their model. This adjustment led to 32% fewer stockouts during peak summer weeks and an 18% reduction in obsolete inventory.
Ensure data integrity by standardizing product codes and removing duplicate records. Clean data often yields better results than advanced algorithms working with messy inputs. To build reliable predictive models, you’ll need at least 18–24 months of historical data. Additionally, conduct quarterly packing audits to identify discrepancies between actual and billed weights, catching dimensional weight (DIM) overcharges before they add up.
Continuous Improvement with Forthmatch
Once you’ve established solid governance and tracking systems, tools like Forthmatch can help maintain and expand your savings. Forthmatch automates the monitoring of order shipping times and flags SLA violations. It analyzes up to 90 days of order history upon installation, turning vague concerns about delays into clear metrics like "15% of orders missed the 24-hour SLA."
The platform also offers an Accountability Session ($89/session), which provides a detailed PDF report after 2–4 weeks. This report compares performance metrics and is perfect for quarterly business reviews or renegotiating contracts. Having this documentation gives you leverage when addressing performance issues with your 3PL.
Forthmatch’s carrier breakdown analytics can show you which shipping providers - whether it’s FedEx, UPS, or regional carriers - perform best for your specific needs. Combine this with the RFP Generator tool ($44 per request) to create data-driven Requests for Proposal. By comparing your current rates to market alternatives, you ensure cost reductions remain consistent over time. This ongoing monitoring complements earlier predictive strategies, keeping your savings on track.
How 3pls Can Start Their Data Analytics Journey In The Age Of AI with Brian Armieri
Conclusion
Predictive analytics is transforming e-commerce logistics by shifting the focus from reactive problem-solving to proactive planning. Instead of scrambling to address issues as they arise, businesses can now anticipate disruptions weeks ahead and make informed adjustments. By analyzing up to 50 variables - such as weather trends and promotional calendars - predictive models can reduce forecasting errors by as much as 50%.
"The organizations winning in today's volatile supply chain environment don't just forecast demand more accurately. They've fundamentally transformed decision-making from reactive firefighting to proactive optimization." – McKinsey & Company
These data-driven insights also enhance 3PL accountability, making it easier to measure and act on performance metrics. Real-time tracking of SLA compliance, including on-time delivery rates and order accuracy, gives businesses a strong edge during contract negotiations. Tools like Forthmatch take this a step further by centralizing data and turning predictions into actionable savings. For example, its Accountability Session feature generates detailed PDF reports comparing performance over 2–4 weeks, offering clear documentation for quarterly business reviews. Today, 77% of logistics partners are investing in such technologies. On the flip side, brands that fail to adopt these capabilities could lose 7–12% of their annual revenue to avoidable supply chain disruptions. These technologies not only drive immediate improvements but also set the stage for long-term operational success.
Sustaining these benefits requires consistent monitoring and strong data governance. Centralizing fulfillment data, conducting regular performance reviews, and using tools that offer carrier analytics and automated RFP generation can help maintain cost savings while supporting scalable growth. Starting with a focused pilot - such as targeting a high-volume product category or a specific distribution center - can demonstrate ROI within 90 days, making it easier to expand these practices across operations. In today’s competitive landscape, relying on gut instincts is no longer an option; data-driven decisions are the key to efficient and effective logistics.
FAQs
How can predictive analytics help e-commerce brands save on 3PL transportation and shipping costs?
Predictive analytics enables e-commerce brands to significantly reduce 3PL transportation and shipping costs by using both historical and real-time data for smarter decision-making. For instance, by forecasting demand, businesses can plan shipments more effectively, cutting down on the need for expensive last-minute deliveries. It also helps optimize carrier selection and routing, reducing fuel costs and avoiding inefficiencies like empty miles.
On top of that, predictive tools can spot patterns that often lead to delays or unexpected fees. This allows businesses to address potential issues before they escalate. By relying on this data-driven approach, brands can streamline their logistics, save money, and manage growth more effectively.
What types of data are crucial for building accurate predictive models in e-commerce logistics?
Accurate predictive models in e-commerce logistics hinge on blending internal and external data sources to cover every step of the fulfillment process. Here’s a closer look at the key data driving these models:
- Historical order and shipping records: Information such as order dates, SKUs, quantities, destinations, and carrier costs uncovers patterns and seasonal trends.
- Inventory and warehouse data: Insights into stock levels, replenishment schedules, and pick-and-pack times help anticipate demand and prevent stockouts.
- IoT sensor data: Real-time updates on variables like location, temperature, humidity, and weight provide a clear view of transit conditions and flag potential risks.
- Carrier performance metrics: Metrics like on-time delivery rates, shipping costs, and accessorial fees guide decisions on 3PL selection and route optimization.
- External factors: Variables such as weather conditions, public holidays, and fuel price fluctuations add context for anticipating disruptions or shifts in demand.
When all of these data points are brought together, e-commerce brands can tap into real-time analytics, streamline quote requests, and evaluate performance to cut logistics expenses. Tools like Forthmatch make this process seamless by integrating historical data, live inventory monitoring, and carrier performance metrics into one dashboard, empowering brands to make smarter, data-driven decisions.
How can businesses evaluate the effectiveness of predictive analytics in cutting 3PL costs?
To gauge how well predictive analytics is cutting down 3PL costs, businesses should begin by setting a baseline and monitoring key metrics like cost per shipment, cost per order, and overall transportation spend. Comparing data from before and after implementing analytics can reveal tangible savings, such as reduced inventory carrying costs or percentage decreases in overall expenses. For instance, if a company saves $250,000 from a $1.2 million baseline, that's a 20.8% reduction.
Other metrics, such as order accuracy rates, on-time fulfillment rates, and warehouse capacity utilization, can offer additional insights into cost changes. Enhanced forecast accuracy can also lead to fewer stock-outs and lower expedited shipping fees, further showcasing the benefits of predictive analytics. Tools like Forthmatch simplify this process by providing real-time fulfillment analytics, automated quote requests, and historical SLA benchmarking, making it easier to track and act on these metrics.
By consistently reviewing these KPIs and calculating ROI, businesses can clearly demonstrate how predictive analytics delivers measurable savings in 3PL operations.